Non College Bound Students
http://eric.ed.gov/ERICWebPortal/Home.portal?_nfpb=true&_pageLabel=RecordDetails&ERICExtSearch_SearchValue_0=ED262256&ERICExtSearch_SearchType_0=eric_accno&objectId=0900000b800ffcd5
A study showed that high school students who are not planning to attend college full time should combine vocational and academic course work to maximize their success in the labor market. In a study of non-college bound youth (based on the High School and Beyond Survey data) that examined the impact of high school curriculum, grades, and performance on standardized tests on labor market success, the following results were found:
- taking additional vocational courses is associated with only a small reduction in the number of academic courses taken;
- taking additional vocational courses is strongly associated with success in the labor market immediately after high school;
- taking additional academic courses is not associated with higher earnings immediately after high school;
- taking a combination of 16 or more academic and vocational courses during the last three years of school enabled students to have greater labor market success than taking fewer than 10 such courses; and
- good grade point averages and standardized test scores generally had mixed effects on labor market outcomes.
The study concluded that school administrators should stress that for the 30-40 percent of high school graduates who do not attend college full time, the choice of high school curriculum is one of the most important decisions they will make affecting their success in the labor market following graduation.
Counselors can help students select the proper balance between academic and vocational subjects to ensure labor market success, and vocational teachers can help students secure jobs.
Two separate studies show there are two distinct curriculum students should take depending on what they plan to do after high school. However, in both cases, increased number of courses does not appear to influence either college bound or straight to labor force choices. It is clear that Academic courses such as math, English, science, Social Studies and language should be the objective of any college bound student. What is not so clear are what courses are considered vocational.
As an engineer I would have enjoyed taking engineering courses in high school had they been offered, but that would have been a mistake. I ended up taking four years of math, English, science, social studies and three years worth of language. Had I decided not to attend college those engineering courses offered at Carroll it would be doubtful these courses would have helped me later on. The real world is a tough environment and you are competing against some excellent non degree individuals who have year’s worth of proven experience. In over 20 years worth of experience at many large and small companies, I have never come across a non degreed individual who was offered a position based on high school curriculum classes. I have seen non degreed individuals do very well, but only after they have gained experience in the field and earned a reputation as one with good work ethics. These individuals have good mathematics, English and communication skills.
Recommended courses to develop essentail skills would be:
Blue print reading – 2 weeks
Sketching (non cad) – 3 weeks
Printing by hand – 3 weeks
Problem solving – 3 weeks
Use of fittings and tools.
Basic electricity
These were the courese offered in the past and seem to have been replaced by technology. However, they are critical today in communicating an idea from the shop floor to those responsible. If you cannot draw, print or communicate any idea you might have to improve something will be difficult to get anyone to listen to you.
Courses for College Bound Students
Of all pre-college curricula, the highest level of mathematics one studies in secondary school has the strongest continuing influence on bachelor's degree completion. Finishing a course beyond the level of Algebra 2 (for example, trigonometry or pre-calculus) more than doubles the odds that a student who enters postsecondary education will complete a bachelor's degree.
http://www.edpartnership.org/?id=1079
The Rhode Island Scholars Course of Study is:
English Language Arts: Four years or course equivalent in:
English I, II, III, IV
Mathematics: Four years or course equivalent in:
Algebra I
Geometry
Algebra II
4th year of higher math
Science: Three years or course equivalent in:
Biology
Chemistry
Physics
Social Studies: Three and one-half years or course equivalent in:
World History Studies
World Geography Studies
U.S. History
U.S. Government
Economics
Language Other Than English: Three years or course equivalent in the same language.
Another source had these recomendations:
English – 4 years
Composition
American Litature
English Litature
World Litature
Mathematics - 3 to 4 years
Algebra I
Geometry
Algebra II
Trigonometry
Precalculus
Calculus
History and Geography – 2 to 3 years
Geography
U.S. History
U.S. Government
World History
World Cultures
Civics
Laboratory Sciences – 2 to 3 years
Biology
Earth science
Chemistry
Physics
Visual and Performing Arts – 1 year
Art
Dance
Drama
Music
Challenging Electives - 1 to 3 years
Economics
Psychology
Computer science
Statistics
Communications
Foreign Language – 2 to 3 years
Does adding additonal courses improve fundamental foundation of education or does it dilute the core courses students need to do well in the future?
NACS Carroll 2005-06 Course Offereings
 Listed below were the course offered at Carroll High School for the 2005-06 school year. This information came from the Indiana Department of Education. The first number idenfities the number of classes this course offered. The first three coureses were combined with another class. The second number identifies the total students who took this course. The third number is the average students per class taking that particulare course.
Combined class, 3, 7.5, French IV
Combined class, 5, 12.5, Japanese IV
Combined class, 10, 16.7, Japanese III
1, 21, 21.0, Adult Roles and Responsibilities
1, 51, 51.0, Advanced Concert Band (L)
1, 21, 21.0, Advanced Foods and Nutrition
1, 15, 15.0, Advanced Health Education
1, 29, 29.0, Advanced Theatre Arts
1, 22, 22.0, Art History
1, 55, 55.0, Beginning Chorus (L)
1, 47, 47.0, Beginning Concert Band (L)
1, 25, 25.0, Business and Personal Law
1, 18, 18.0, Chemistry II (L)
1, 15, 15.0, Choral Chamber Ensemble (L)
1, 11, 11.0, Computer Graphics (L)
1, 26, 26.0, Computer Keyboarding or Document Formatting
1, 18, 18.0, Creative Writing
1, 14, 14.0, English Language and Composition, Advanced Placement
1, 21, 21.0, Environmental Science, Advanced (L)
1, 16, 16.0, Etymology
1, 14, 14.0, European History, Advanced Placement
1, 16, 16.0, Finance Academy
1, 28, 28.0, French II
1, 22, 22.0, Fundamentals of Agricultural Science and Business
1, 21, 21.0, Human Development and Family Wellness
1, 25, 25.0, Instrumental Ensemble (L)
1, 30, 30.0, Interdisc. Coop Educ. - On-the-job Training (ICE)
1, 18, 18.0, Interdisc. Coop Educ. - Related Instruction (ICE)
1, 44, 44.0, Intermediate Concert Band (L)
1, 32, 32.0, Japanese I
1, 18, 18.0, Japanese II
1, 28, 28.0, Jazz Ensemble (L)
1, 21, 21.0, Journalism
1, 22, 22.0, Landscape Management
1, 17, 17.0, Music History & Appreciation
1, 17, 17.0, Music Theory and Composition (L)
1, 21, 21.0, Novels
1, 8, 8.0, Physics B, Advanced Placement (L)
1, 22, 22.0, Probability and Statistics
1, 50, 50.0, Psychology
1, 19, 19.0, Spanish V
1, 15, 15.0, Technical Theatre (L)
1, 13, 13.0, Technology Systems (one (1) or two (2) semesters)
1, 17, 17.0, Transportation Processes (one (1) or two (2) semesters)
1, 17, 17.0, Trigonometry, 1 semester (formerly Trigonometry - 2 sem.)
1, 20, 20.0, Vocal Jazz (L)
2, 24, 15.0, French III
2, 77, 38.5, Advanced Chorus (L)
2, 30, 15.0, Advanced Life Science: Animals (L)
2, 53, 26.5, Advanced Science, Special Topics (L)
2, 47, 23.5, Anatomy and Physiology
2, 25, 12.5, Biology, Advanced Placement
2, 41, 20.5, Business Foundation
2, 37, 18.5, Calculus AB, Advanced Placement (formerly Calculus, Adv
2, 57, 28.5, Career Planning and Success Skills
2, 38, 19.0, Ceramics (L)
2, 47, 23.5, Child Development and Parenting
2, 38, 19.0, Computers in Design & Production Systems (1 or 2 semesters)
2, 35, 17.5, Construction Processes (one (1) or two (2) semesters)
2, 34, 17.0, Design Processes (one (1) or two (2) semesters)
2, 45, 22.5, Digital Communication Tools
2, 33, 16.5, English Literature and Composition, Advanced Placement
2, 45, 22.5, Entrepreneurship
2, 28, 14.0, Fashion & Textiles Foundations (frmly Textiles & Fash Tech)
2, 12, 6.0, Fine Arts Connections
2, 39, 19.5, Fundamentals of Engineering (one (1) semester)
2, 40, 20.0, Interpersonal Relationships
2, 29, 14.5, Life Science (L)
2, 38, 19.0, Manufacturing Processes (one (1) or two (2) semesters)
2, 47, 23.5, Marketing Foundations
2, 34, 17.0, Physical Science (L)
2, 32, 16.0, Sculpture (L)
2, 45, 22.5, Spanish IV
2, 41, 20.5, Speech
2, 27, 13.5, Technology Enterprises (one (1) semester)
3, 60, 20.0, Accounting I
3, 50, 16.7, Agricultural Mechanization
3, 60, 20.0, Career Information and Exploration
3, 68, 22.7, Computer Applications
3, 51, 17.0, Drawing (L)
3, 54, 18.0, French I
3, 25, 8.3, Investigative Geometry
3, 74, 24.7, Nutrition and Wellness
3, 84, 28.0, Physics I (L)
3, 80, 26.7, Sociology
3, 33, 11.0, Student Publications
3, 44, 14.7, Theatre Arts (L)
3, 57, 19.0, United States History, Advanced Placement
4, 91, 22.8, Animal Science
4, 83, 20.8, Communication Processes (one (1) or two (2) semesters)
4, 56, 14.0, Media Arts (L)
4, 100, 25.0, Pre-Algebra
6, 42, 7.0, English Literature
6, 153, 25.5, United States Government
7, 143, 20.4, Basic Skills Development
7, 193, 27.6, Earth and Space Science I (L)
7, 157, 22.4, Economics
7, 73, 10.4, Language Arts Lab
7, 71, 10.1, Mathematics Lab
7, 145, 20.7, Pre-Calculus/Trigonometry-2 sem. (formerly Pre-Calculus)
8, 205, 25.6, Health and Wellness Education (formerly Health Education)
8, 179, 22.4, Spanish III
8, 209, 26.1, World History or Civilization
9, 223, 24.8, Introduction to Two Dimensional Art (L)
9, 251, 27.9, Spanish I
9, 237, 26.3, World Geography
10, 263, 26.3, Spanish II
11, 251, 22.8, Biology II (L)
11, 254, 23.1, Chemistry I (L)
12, 320, 26.7, Algebra II
12, 286, 23.8, Elective Physical Education (L) (frmrly Adv. P.E.)
12, 297, 24.8, United States History
14, 331, 23.6, English 12
16, 475, 29.7, Physical Education I (L)
17, 357, 21.0, English 11
17, 387, 22.8, Geometry
18, 468, 26.0, Algebra I
19, 463, 24.4, English 10
20, 439, 22.0, Biology I (L)
20, 480, 24.0, English 9
Do larger schoosl offer more courses?
The June 1, 2005 Feasibility study had a statement on page 7
"students would have a wider selection of course offerings and electives from which to choose."
Is this a true statement? It sounds good, but did they really take the time or effort to quantify this? I became curious when I read the following statement on page 6.
"The attached CHS profile shows the courses currently offered in each department’s divisions and the attached table shows the respondents’ suggestions of courses to add and the status of those courses. Respondents were asked to list courses to add in their department as well as in other departments. "
It sure sounds like they put a list together so I checked it out. On page 8 I find the list, but it only has 45 different courses and not all of these are current. Just how many courses are actually offered? At the Indiana Department of Education I found 120 courses were offered at Carroll in 2005-06 school year.
The bad thing is nothing in the reporst supports the Feasibility's position that larger schools offer more courses. How would one go about calculating just how many additional students are needed to offer another course?
- The courses to be offered are not core classes since they are already offered and required by the state.
- Core classes make up what percentage of the student’s total potential courses? If there are six periods in a day and the student goes four years, then the most courses they can take is 6 x 8 semesters = 48 courses of, which 40 courses are basically dictated by the state. This leaves 8 electives.
- Now if the student takes 7 courses per semester, then they could theoretically take 16 electives
- If teaches teach 125 to 150 students, then they must have about six class they teach. If enrollment increases by 150 students, then we will need six new teachers, Five to teach core courses and one that available to teach an elective/new course.
Does this mean that for every 150 students, the school could offer an additional course? Keep in mind that the current "46 unique courses" where there is only one class offered would most likely see enrollment increase. As the size of the school increases, the potential students enrolling would most likely choose to take one of the existing courses. In engineering we call this diminishing returns or peeling the onion. Taking this to the next step, going from 1800 students to 2400 students will add 600 students, which means the school might be able to offer four additional courses.
Here are some classes offered:
 Advanced Composition
Math Lab - if a student fails a math class, they take this. Why not have them take the class over?
Web Design *
Art and Set Design
Engineering/Problem Solving *
Mass Communications
Water Sports * (Could be embedded in elective PE)
Computer Graphic Design
Internship in Technology
Shakespeare
Concert Choir
Applied Music
Health Career Internship
Aerobics
Body Building
Advanced Chemistry
Calculus BC
* Embedded courses are components of another course offering or could be embedded into current course offerings.
What would have been nice to see in the feasibility study is some thought and supporting information. They surely have data on the course offerings for each year since Carroll opened. How have the number of courses changed? From my look at this, I would say course offereings would increase, but is it worth it? As the number of courses increase so does scheduling problems; core curriculum classes class size increase; and building utilization factors decrease.
What I do know is that the ISTEP tests math, English and reading. Do these extra courses help improve ISTEP test scores? What happens when students are given the choice between a science, math or English class and bodybuilding, water sports or aerobics? How many take the easy way out?
It is nice to be able to offer so many diverse courses, but I wonder if it is the right thing to do. Are we shortchanging their education? Over the past thirty years there has been a trend to increase courses and segregate courses into advance and non advance, is this a good practice? As course offerings increase the data shows the core classes student to teacher ratio increases while the student to teacher ratio for these new courses are much lower. In my opinion new courses are added at the expense of our core curriculum classes.
The purpose of a public K-12 education is to teach them the basics, how to teach themselves and if prepare them for higher education. It is not to duplicate or replaced higher education. There is some reference to offering enginerring as a course. Maybe a first step is to begin every answer by stating the students interpretation of the problem, identifing knowns and unknowns and from there move forward in answering the question.
Are Carroll's Classes over Crowded?
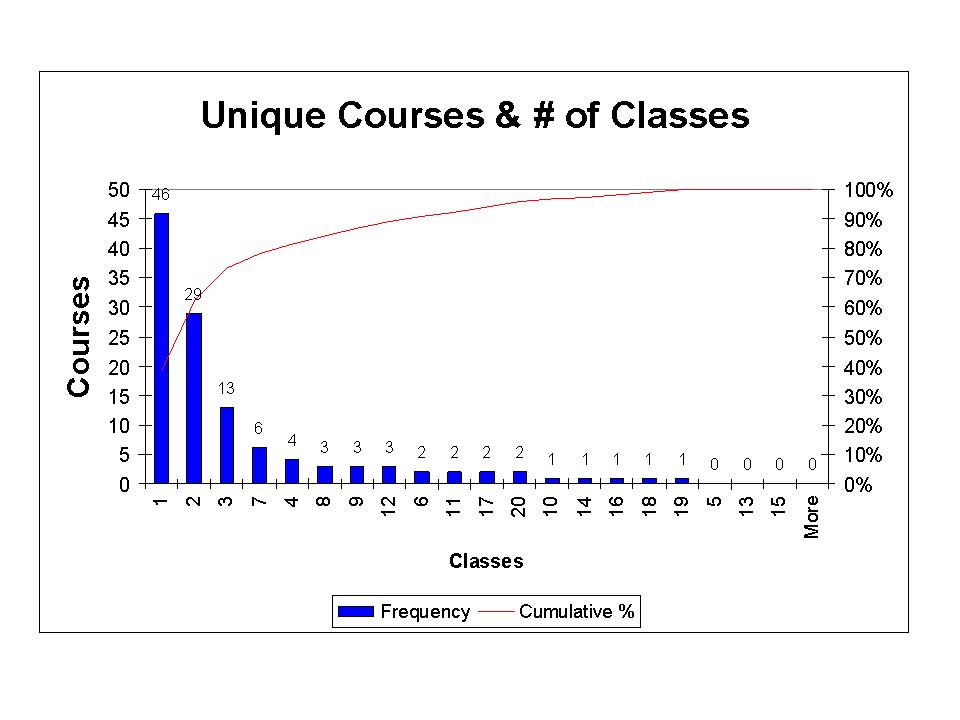
There were 120 unique course offereings in the school year 2005-06.
Using the Indiana Department of Education's data for 2005-06 school year I calculated the number of classes and their respective students. To read this first chart, there were 46 courses that offered only one class. There were 29 courses where there were enough students to fill two classes.

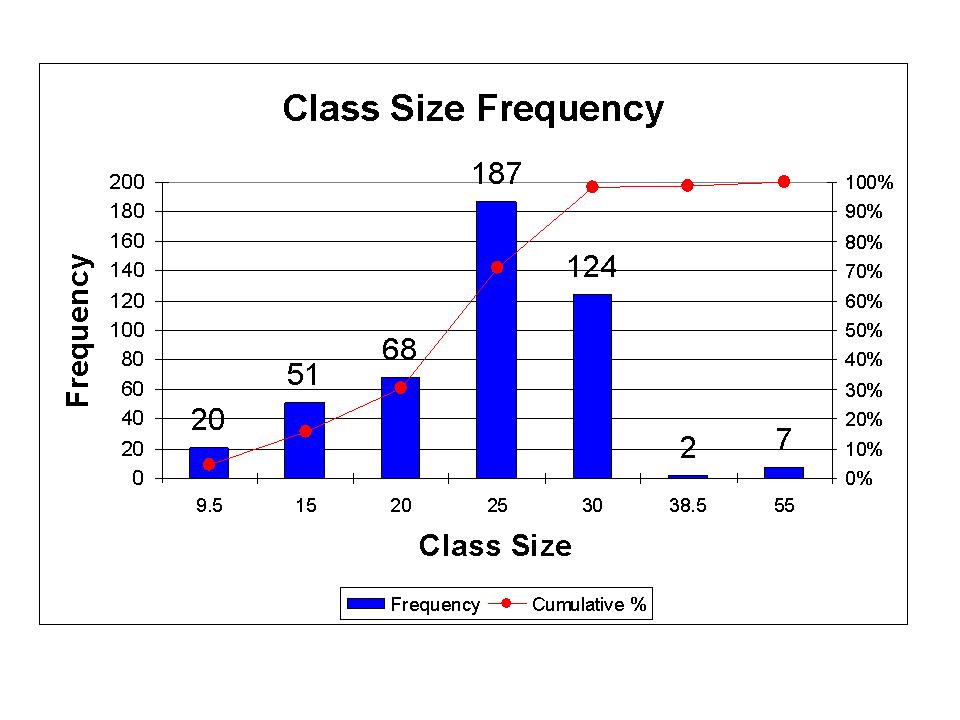
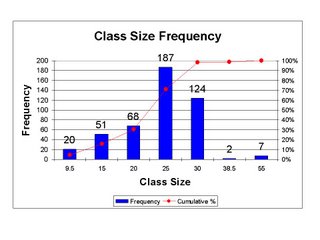
The next slide identifies how many classes had what number of students. There were 20 classes with less than 9.5 students. Now this may be a bit erroneous because I understand that Japanese V is combined with IV. There were 51 classes 10 to 15 students; 68 classes with 15 to 20 students; 187 classes with 20 to 25 students; 124 classes with a class size of 25 to 30. There were nine classes with over 30 students. These were Band and music.
The next slide identifies how many classes had what number of students. There were 20 classes with less than 9.5 students. Now this may be a bit erroneous because I understand that Japanese V is combined with IV. There were 51 classes 10 to 15 students; 68 classes with 15 to 20 students; 187 classes with 20 to 25 students; 124 classes with a class size of 25 to 30. There were nine classes with over 30 students. These were Band and music.
NACS Ignorance and lack of attention to detail
The June 1, 2005 NACS Feasibility Study on page 13 defines Capacity in the following way.
“The 100% student capacity of the current high school 10-12 building is 1,625. This number was calculated by multiplying the number of available classrooms, 69 (as identified by the principals), by 25 (standing for the optimum number of students per classroom at the high school level.) An 85% portion of the total student capacity is 1,381, or otherwise known as the optimal occupancy figure, and was used to calculate a maximum efficiency usage for the building. The current student population of the 10-12 building is 1,145; this is about 70% occupancy. As the occupancy rate exceeds the 85% level, concerns or the pains of overcrowding occur, such as scheduling troubles, crowded lunch lines, traveling teachers, dangerously crowded stairwells and hallways, etc.”
Did you follow that? Now take a look at Table T-9 on page 35. Capacity is identified as 1,700 and optimum capacity as 1,445. The premise is there are 69 classrooms that can accommodate 25 students each. When I multiply 69 by 25 I get 1,725, not the 1,700 listed in Table T-9 nor the 1,625 listed on page 13. I am not sure, but it looks like these numbers come from multiple different studies about different schools or the “experts” are not experts.
Now take a look at the Freshmen Academy.
“The 100% student capacity for the Freshman Campus is 700. This is based on 28 available classrooms multiplied again using 25 as the optimum number of students per teacher ratio, to get a figure of 700. The 85% optimal occupancy figure of 595 was again used as the target goal for maximum building efficiency usage. The current student population of the freshman campus is 447, or 75% occupancy. The conversion of the middle school to a freshman campus has been a very positive solution to the fast-pace growth of the district. It has brought a temporary reprieve to the need for high school growth. These current building occupancy results as applied to the previous demographic data available to the committee shows a definite need to move forward with some form of high school expansion.”
Table T-9 on page 35 identifies the capacity as 700. Ok, this matches the study’s number. They list 28 classrooms that can accommodate 25 students each. The product of these two numbers is 700. They match, this is good.
My question now is with design capacity and optimum capacity. Design capacity is the target value at, which cost effectiveness is most efficient. It is the criteria used to determine the size of a school in terms of cafeteria, class rooms, hallways, administration, library, gyms, shops, utilities and any other aspect that is dependent on the number of bodies envisioned the school is to cope with.
These experts state ”An 85% portion of the total student capacity is 1,381, or otherwise known as the optimal occupancy figure, and was used to calculate a maximum efficiency usage for the building.” This disturbs me in a number of ways.
First, who designed the school to begin with, were they contacted? Did these experts even look at the original design criteria of the school or are they “swag’ing” it? The number 25 just pops out of thin air. We have all been in buildings and they all have an occupancy limit. These are calculated based on a number of variables with one being the number of exits.
Second, they reduce design capacity to 85%. As an engineer, the performance of the process improves as you reach 100%. However, in this case maximum efficiency declines as you approach 100%. My question is why? My first thought is, is the 25 students per classroom not correct?
Third and most important of all, they state they ar”multiplying the number of available classrooms, 69” (as identified by the principals), by 25 (standing for the optimum number of students per classroom at the high school level.)” arrive at design capacity. However, as with any mathematics, chemistry and particularly physics, one must pay careful attention to units. When I multiply (69 classrooms) x (25 optimum-students per classroom) I get 1,725 optimum students. However, this study calculates optimum capacity to begin with and then reduces it by another 85%.
Fourth, in the Academy calculation they use
"25 as the optimum number of students per teacher ratio"
and with the High School they use
"25 (standing for the optimum number of students per classroom at the high school level.)"
What grade would you give this report? Simple math errors, wrong units, mismatched units and more. They want to spend $63.75 million. I would expect a report that warrants an A+ before I support spending this amount.
It is sad to find that optimum is not defined anywhere. What I have identified is the sole basis for this study, enrollment capacity. I have shown that the study’s units are incorrect, values are incorrect and results are incorrect. The entire study is wrong, building size, heating & ventilation, cafeteria, gym, hallways, administration offices and more are based on design capacity and when your criteria is wrong, the entire design will be wrong.
This petition drive is not about two high schools, but is about spending taxpayer’s money wisely. We have years before additional high school capacity is needed. We have years to perform a real study, using real numbers, using good accounting standards and from these create a long-term plan for NACS.
Sign Blue to keep property taxes low through responsible spending and accounting of taxpayers’ money.
I have sent my analysis of Table T-9 to hundreds of people. By far the replies I have received have been very supportive and thanked me for my effort. Many have simply asked that I remove their name from my email list, which I do. However, I have received a few responses from people who have not appreciated my analysis. For the most part they have a common them "that I manipuated the numbers."
If as one says “anyone can make the numbers to mean anything”, then how are we to believe the NACS June 1, 2005 Feasibility study? As an Engineer, I strive to understand numbers. It is my profession to understand the assumptions, methodology and to verify that the numbers and methodology when combined, produce the stated result. The single purpose of any report is to present enough information so that any person may verify the results that are stated. This Feasibility Study lacks assumptions, raw numbers as well as methodology.
When I look at table T-9, it is standard procedure to take the values listed in the table and verify that they correspond with others. This is exactly what I did. Carroll High School has 309,000 sq. ft. with a design enrollment of 1,700. When you divide the 309,000 sq. ft. by 1,700 students I get 181.76 sq. ft per student. When I take the new school estimate of 356,250 sq. ft and divide it by the design enrollment of 1,425 students, I get 250 sq. ft. Does this not cause concern to anyone else but me? Why is the new school 15% larger and have 16% fewer students? If you are trying to convince someone to support your position of one high school, you might attempt to inflate the other options cost. This certainly is an easy way to do it. Did anyone else check the math on Table T-9?
But this is not the only cross reference check that can be made using this table. The renovation cost of Carroll has a note 4 attached to it. It states the renovation cost is $65 per sq. ft. for both options. Carroll has 309,000 sq. ft. and when multiplied by $65 per sq. ft. I get $20,850,000. But when I look at the cost for the renovation option, I see the table has $27,460,000 for the same multiplied numbers. How can this be? This is basic math. Was this study even reviewed and if so by whom?
The number of errors or inconsistencies on this one table are numerous. I am not playing with the numbers; I am only identifying the errors and inconsistencies. Responsible taxpayers do not make decisions based on errors or inconsistencies. They require correction of these errors so that an educated decision can be made. We are under no gun to make a decision on a renovation or a new school. The demographers forecasts the high school enrollment will reach 2,431 in the 2015-16 school year.’ That is more than enough time to do a real feasibility study.
Of all the people I have sent Table T-9 too, not one has presented a specific comment of disagreement with my numbers. If I have an error, please by all means identify it so that we may all be better informed.
Sign Blue to keep property taxes low through responsible spending and accounting of taxpayers’ money.
Is Carroll High School Mismanaged?
On September 21, 2006 I recieved this from a staff member at Carroll.
I'm not sure how you got my email or why I keep getting your trash but I'm sick of it. You can manipulate these numbers and say whatever you want to say but the fact of the matter is that you are grasping at straws. The board has spent countless hours and has done real studies to get their numbers.
I am an employee of NACS and we can't even talk about this situation when we are in the building. So why is it you can send me your garbage without me having ever asked for it?
I work in CHS everyday. We need renovations now. You may think we are 80% capacity but we need more room now. There are new teachers who don't have a classroom and move from room to room on carts, teachers who can't use their classroom for there prep period because it's being used by someone else. The offices are cramped and inefficiently set-up. The cafeteria is packed. The gym is standing room only for pep sessions and convocations. You don't have any first hand knowledge of what this building needs.
You and your group of remonstrators should have spoke up long ago when all the studies and demographic studies were being done. Now, if your side wins, you are going to but this whole process on hold which is going to negatively affect the upcoming students of this building. My son is one of those kids.
This is the 3rd email I have received from you and I prefer not to receive a 4th. Email your little group of supporters but keep me out of it
I find this interesting because of several statements.
"There are new teachers who don't have a classroom and move from room to room on carts, teachers who can't use their classroom for there prep period because it's being used by someone else.
This is a very interesting statement when you think about it. The feasibility study states that design capacity is calculated by the number of classrooms times 25 students per classroom. Pretty straightforward and I have no problem with it. Based on the 2205-06 school year, the student to teacher ratio at Carroll is 18.3 to 1. At the Freshmen Academy it is 15.6 to one. Carroll had 68 teachers while the Academy had 30. However, 11 of these teachers are dual schoolteachers who teach at both schools. The student-teacher ratio is very low.
- How do you have more teachers than classrooms? Are these teachers teaching in the hallways?
- Are some teachers only part time?
The board has spent countless hours and has done real studies to get their numbers.
Yes, they may have spent countless hours, but this does not make their study valid nor real. A readl study provides references, assumptions, methodolgy and results. This is done so that anyone may pick up the report or study and verify its validity. As I have shown Table T-9 does not add up. This table is the sole basis for the NACS board voting to support renovation. Did anyone review their report?
"The offices are cramped and inefficiently set-up. The cafeteria is packed. The gym is standing room only for pep sessions and convocations. You don't have any first hand knowledge of what this building needs."
Yes, it is crowded now with 1,303 student this school year at Carroll. According to the design parameter it should be able to handle another 497 students with no problem. Keep in mind Carroll went through an $18 million renovation ten years ago. Did they not foresee this problem during the last "feasibility study?" But the renovation wants to add another 700 students on top of the 497 students. If you think it is crowded now, just wait until after the renovation. Let us add up the cost of renovations and additions to increase Carroll High School.
- $18 million to renovat and add 200 seats
- $0.9 million to convert Carroll Middle School to an Academy and added 700 seats.
- $35 million to build a new Carroll Middle School to replace the one they converted.
So far the board has spent over $54 million to increase capacity at the high school level and notw they want to spend another $63.75 million. Add it up, when they get done they will have spent over $118 million to increase capacity. How much did our taxes increase for this?
"You and your group of remonstrators should have spoke up long ago when all the studies and demographic studies were being done."
I went to several board meetings and asked direct questions of the superintendent and the board. Not only did they not answer the question, but also in some cases said the meeting was to vote on renovation only. The board has never presented to the taxpayers a side by side analysis or presentation of a new school and renovation. They voted no on a new school years ago and then moved onto renovation. This is not the old Soviet Union where there is just one choice and you support the party. This is the United States of America and in this great land I expect two or more options be presented. I will not sit by and not raise my voice in protest to the sham.
"Now, if your side wins, you are going to but this whole process on hold which is going to negatively affect the upcoming students of this building. My son is one of those kids."
Yes, if there are more blue signatures than yellow, then the board cannot move forward with renovation. I want a real study done using good assumptions that are documented, with real estimates for land, buildings, parking, athletic facilities and soft costs. I want to know what technology upgrades mean. I want to know what the costs are estimated to be. Table T-9 in the Feasibility Report is WORTHLESS!
Based on the Feasibilty study they person relies on so much, the combined capacity of the high school and Academy is 2,400. On August 29, 2006 the combined enrollment was 1,1819. According to the demographer capacity will not be exceeded until 2015-16 school year and then by just 31 students.
In God I trust, all other bring data.
NACS Technology, what is it?
I have heard that part of the reason behind renovating Carroll High School is to upgrade its technology. What exactly does this include? I have heard a value of $10 million, but never seen an actual dollar value placed on this upgrade. The only source I know is the June 1, 2005 Feasibility Study. A quick search of this study identifies four locations where the word “technology” is used.
- Page 8, “Internship in Technology “
- Page 13 “The original Carroll Middle School, built in 1987 on 40 acres was converted to the Freshman Campus for the 2004-05 school year. The science labs, music rooms, and industrial technology rooms were renovated, and carpeting was replaced. Rooftop units were replaced, mechanical controls added, and the parking lot was redesigned. This renovation cost $919,514.”
- Page 15, “a need for improved technology (11 responses)”
- Page 40, “The committee believes that renovation to the current high school, especially in technology, needs to begin soon and does not require a timeline concurrent with new construction. “
If the actual number proposed is $10 million, what on earth are they buying? You would think that to come up with a $10 million value, they must have had something in mind, what is it? If your child came up to you and asked you for $10,000 what would you do? Would you ask what they wanted it for? What if they could not identify what they wanted it for, would you give it to them? This is no different. Here the School Board has agreed to pay for Technology upgrades yet failed to identify what they are.
Let us put these technology costs in perspective.
$10 million in technology upgrade is equivalent to giving each freshman who enters the High School System over the next ten years $2,100. Will these technology upgrades last ten years? If not then the cost per student increases.
A good used CNC machine costs about $300,000. A good used Robotics system costs about $250,000. What kind of technology could you put in a high school that costs $10 million?
Let us review the purpose of a public high school education. The purpose of public high school is to teach students how to teach themselves and prepare students for further education. It is not to replace college or post high school education.
Before I sign my name to a petiton authorizing the School Board to spend $63.75 million, I want to know what they plan to do with it. If they are basing the values in the feasibility study on something that is not in the study, then there must be references to it and preferably it should be attached as either an appendix or addendum.
In God I Trust, all others show data.
In God I Trust, all others bring data!
Some individuals are writing some pretty obvious falsehoods about the NACS petitions. In some cases they contradict themselves several times in the same article. However, the common theme is they do not present any data nor refernce to support their position. My data comes from;
http://mustang.doe.state.in.us/TRENDS/schlprofile.cfm?schl=
http://www.nacs.k12.in.us/
NACS June 1, 2005 Feasibility Study
Here are some of the most blatant myths.
Myth: A second high school will cause a reduction in course offerings and programs for all students in grades K-12.
Truth: Course offerings such as advance placement already have enough students to offer multiple classes now. Two schools have enough interested students to efficiently and economically offer the same courses now. A review of teacher certifications shows that there are at most eight teachers that have unique certificates. At most only eight additional teachers would need to be hired. However, with higher enrollment numbers, comes the need for additional teachers with these certifications. Thus, the actual number of additional teachers required to provide the same courses now may be far less. The purpose of public high school is to teach students how to teach themselves and prepare students for further education. It is not to replace college or post high school education. Offering additional courses does not increase ability of the student to obtain a position nor enhance their ability to enter higher education; rather it dilutes the core subject base. In simple terms it provides more electives to choose from.
Myth: A second high school will increase class sizes for all students in grades K-12 because NACS will not be able to afford as many teachers.
Truth: The current student teacher ratio is 19 to 1. Studies show there is no correlation between class sizes under 30 and academic performance. This is a red herring statement. Teaching positions are based on enrollment numbers. There were 87 unique teachers at Carroll and the Academy last year. Two separate schools. The Academy had a lower ratio with fewer students. If you increase class size, then they must be maintaining course offerings. A 10% increase in class size (from 19 to 21 students) is equivalent to ten new teachers. A well run school should be trying to maintain at least a ratio of 25 students to each teacher to keep costs low for good utilization of infrastructure and staff.
Myth: A second high school will possibly eliminate the Freshman Academy. Why eliminate a program that is doing what it was designed to do?
Truth: The NACS board has presented no data to substantiate its success nor have they identified criteria used to measure success. The academy is an academic provider and as such any success or failure needs to be measured in terms of academics, not touchy, feely and subjective feelings. In God I trust all others bring data.
Myth: A second high school will cause an estimated annual increase in operational costs by $2.9 million.
Truth: The NACS June 1, 2005 feasibility study on page 36 identifies a net increase in operating costs of $1,123,288. This is based on a new school size of 356,250 sq. ft. that is 38% larger per student than the current Carroll high school. Building a correctly sized high school would be 240,838 sq. ft. This is 115,412 sq. ft. smaller than the study’s school and reduces net operating costs by $461,648 per year. In addition the study did not evaluate the cost of bussing. Bussing to two schools will be cheaper than bussing all students to one. Two high schools would reduce maintenance, fuel and labor costs. A proper cost evaluation would look at all costs over the life of the schools. As buildings age, they require ever more expensive maintenance.
Myth: A second high school will exceed the board’s proposal by an estimated $54.2 million.
Truth: The sum of the parts is greater than the whole. The NACS Board proposes to spend $63.75 million. The NACS board spent $18 million to increase capacity by 200 students; spent $0.9 million to convert the Carroll Middle School to a Freshmen Academy; spent over $35 million to build a replacement middle school all with the intent to increase capacity at the high school level. The NACS board has spent over $54 million to date and plans to spend another $63.75 million for a total of over $118 million. Is this cheaper?
Myth: A second high school will cost taxpayers about 129 percent more than the board’s recommendation. Do you want to pay more taxes?
Truth: According to the NACS June 1, 2005 Feasibility Study, it will not cost $118 million. The NACS $118 million has $20 million in Carroll upgrades, $27 million in athletic facilities, uses construction costs of $275 per sq. ft. versus $161 per sq. ft, uses 250 sq. ft. per student versus the current Carroll design of 181.76 sq. ft per student. When these errors are corrected a new high school is estimated using their construction cost of $275 per sq. ft. at $66 million. New high school for $66 million or renovated 37 year old school for $63.75 million?
Myth: Two high schools would increase property taxes significantly more than what is needed.
Truth: The band-aid approach instead of using a long term plan has increased our property taxes significantly. Renovation of a nearly 40 year old building is not long term planning and costs more in the long term. Renovation is a band-aid approach resulting in higher taxes five years from now.
Myth: Two high schools will cost far more and provide far less to our students.
Truth: Two high schools will provide the same level of education at lower cost long term through lower maintenance and better utilization of infrastructure.
This petition drive is not about two high schools, but is about spending taxpayer’s money wisely. We have years before additional high school capacity is needed. We have years to perform a real study, using real numbers, using good accounting standards and from these create a long term plan for NACS. Sign Blue to keep property taxes low through responsible spending and accounting of taxpayers’ money.
Just the Facts!
Fact: The proposed new High School is 38% larger per student than Carroll High School.
Fact: The proposed new High School had nearly $27 million allocated to athletic facilities.
Fact: The $118 million price tag included $20 million for Carroll High School upgrades.
Fact: The proposed new High School used 250 sq. ft. per student at $275 per sq. ft while Carroll High School has 182 sq. ft. per student and used $161 per sq. ft. for Carroll’s new addition. Did the study double count the cost of athletic facilities?
Fact: The two school cost estimate had a capacity of 2,656 students while the renovated Carroll School would have 2,571. Additional students increase costs regardless of a single school or two school option.
Fact: $10 million in technology upgrades is equivalent to giving $2,100 to each freshman over ten years to buy a computer. Will these technology upgrades last ten years? If not then the cost per student increases.
Fact: Custodial and Food service personnel are dependent on enrollment only. Therefore two separate schools do not increase or decrease these staffing positions.
Fact: Carroll High School and the Freshmen Academy have their own principal, assistant principals, librarian, nurse and guidance counselor(s). Opening a second High School and closing the Freshmen Academy does not increase or decrease the existing staff. Therefore two separate schools do not increase or decrease these staffing positions...
Fact: The staffing cost estimate for two staffs identifies a $1.1 million net increase over a renovated Carroll, not $2.9 million.
Fact: Building the same size school in relationship to Carroll’s design enrollment will reduce the study’s estimated maintenance, utilities and custodial costs by $461,648 per year.
Fact: The NACS board spent $0.9 million to convert Carroll Middle School to a Freshmen Academy.
Fact: The NACS board spent $35 million to build a replacement middle school for Carroll Middle School.
Fact: The NACS board spent $18 million ten years ago to renovate and increase enrollment capacity by 200 seats to Carroll High School.
Fact: The NACS board has spent nearly $54 million to increase Carroll’s enrollment capacity and now they want to spend another $63.75 million to increase it further for a total of over $117 million.
Fact: The designed enrollment capacity of Carroll and the Freshmen Academy is 2,400 students. As of August 29, 2006 total enrollment was 1,819 students or 76% of capacity. According to the NACS demographer, enrollment will not reach 2,431students until the 2015-16 school year. No renovation or new school is needed for nine years.
Fact: When and if a second high school is needed, the enrollment of each school will be over 1,150 students. This was the enrollment of Carroll in 1997-98 school year.
Fact: The purpose of public high school is to teach students how to teach themselves and prepare students for further education. It is not to replace college or post high school education.
This petition drive is not about two high schools, but is about spending taxpayer’s money wisely. We have years before additional high school capacity is needed. We have years to perform a real study, using real numbers, using good accounting standards and from these create a long term plan for NACS. Sign Blue to keep property taxes low through responsible spending and accounting of taxpayers money.
Table T-9
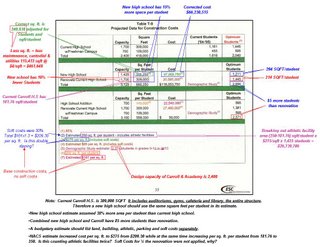
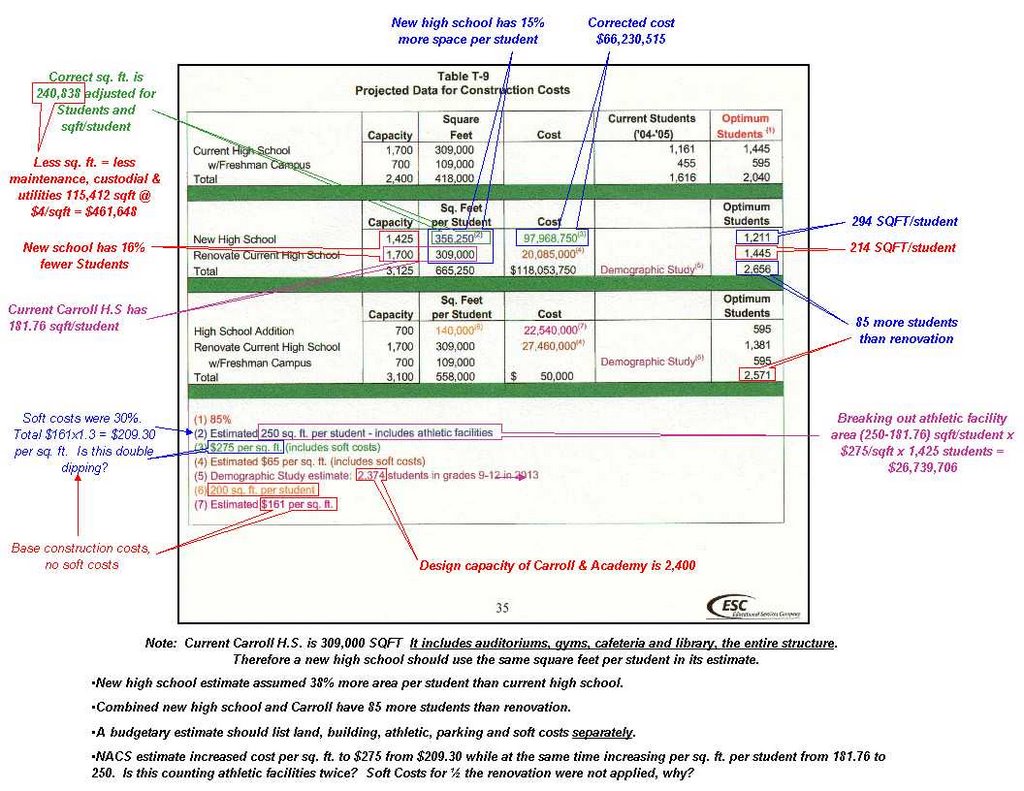
Table T-9 is found on Page 35 of the NACS Feasibility Study. I have highlighted what I think are the important values to look at.
First is the size of the proposed new high school in relationship to the current Carroll high school. The Proposed new high school has 16% fewer students and 15% larger in size.
The optimum enrollment column shows the combined new high school has 85 more students than the proposed renovation at Carroll.
Adjusting the optimum design enrollment number to produce a combined two high school total enrollment of 2,571 reduces the building size from 356,250 sq. ft. to 240,838 sq. ft. Based on $275 per sq. ft. this new high school would cost $66,230,515.
Carroll High School’s design criteria was 181.76 sq. ft. per student. It really makes no difference if you use optimum or design numbers, as long as you use there respective enrollment numbers.
However, there is most likely another major error on this table. Note 2 states they assumed 250 sq. ft per student to cover building and athletic facilities. This means the difference between the design standard of 181.76 sq. ft. per student and 250 sq. ft multiplied by the enrollment number of 1,425 multiplied by $275 per sq. ft. should be the cost attributed to the athletic facilities. If so, this table identifies $26,739,706 as its cost. Is this correct? Or is it that this table actually shows it counting the athletic facilities twice?
For example, note 3 identifies the cost of the new high school at $275 per sq. ft., which includes soft costs of 30%. Note 7 identifies costs for new construction at Carroll of $161 per sq. ft. that does not show soft costs. Is the difference between the $275 and $161 including the athletic facilities as well?
This is a poor table to put into a feasibility report. At a minimum the costs for land, building, parking, athletic facilities and soft costs should be identified separately.
Yellow or Blue, What do they mean?
The yellow petition is for those in favor of allowing the School Board to move forward with spending $63.75 million. The blue petition is for those opposing moving forward with spending $63.75 million.
The blue petition does not mean a new second high school will be built. It’s only legal meaning is, if and only if there are more blue petition signatures than yellow petition signatures, that the vote by the school board to authorize spending $63.75 million to renovate Carroll High School is void. In other words it rescinds the vote by the board. Without a legal vote authorizing the expenditure of money, no funds can be spent.
The school board is allowed to bring the very same project up for a vote in one year. It is also within its discretion to bring up alternatives. Hopefully the school board would use this one-year to evaluate multiple proposals and do a better job of reviewing all the numbers. In addition it would be advisable to publish any reports on the NACS web site.
I have come to the conclusion that both sides, Blue and Yellow have several errors they are putting out. Who is correct? All I know is Table T-9 that identifies the cost for a new high school is full of errors. They are so blatant that no calculator is needed. They show a new high school designed with a capacity of 1425 students with 356,250 square feet where as Carroll with a design capacity of 1,700 students has 309,00 square feet.
Why does a new high school have 38% more space per student than the current high school? The study used construction costs of $275 per square foot. I do know that if you built an equivalent high school that the square footage would be about 107,000 square feet smaller. This means the highly publicized $98 million drops considerably to $66 million.
Custodial, utility and maintenance costs were estimated at $ per square foot. Multiplying the over sized school by $4 per square foot shows that these costs were inflated by $428,000.
Two blatant errors. What others are there that are not even in the report?
We have time before we need to add high school capacity. If renovation was good now, it will still be good one year from now. However, if renovation is actually the worst way to go and we sign yellow, we have made a mistake we cannot take back. I favor caution and support signing blue. This gives us a year to get the facts straight so we can make an educated decision based on good numbers.
NACS May 1, 2001 Survey Resultsi
The May 1, 2001 survey results show the questions dealt little with academics and overwhelmingly about warm, fuzzy, non-quantitative issues. Out of 25 questions I found these dealt with academics. The questioners were asked to rank their opinion 1-5 with 5 being outstanding and 1 being terrible.
25. The educational program meet the requirements of students with special needs. 2.036
22. Our schools are doing a good job of preparing students for the workforce. 3.046
19. Our schools are doing a good job of preparing students to continue their schedule at more advanced levels. 3.329
7. The educational program offered to students is of high quality. 3.779
I was dismayed that so few questions dealt with the sole purpose of a public education. Maybe I am wrong, but is not the purpose of public schools to educate, teach our children how to learn, how to use references and think, not just regurgitate information.
Question 22 is disturbing. "Our schools are doing a good job preparing students for the workforce" scored the middle of the range. Much like a grade of C with an average score of 3.05. In fact all the questions dealing with academics were grade C or below. Questions concerning what I would consider fuzzy, warm non-quantifiable scored the highest. The one area that schools main focus should be on were lowest.
Warm, fuzzy non quantifiable questions.
24. School board members are responsive to the needs of the school community. 2.736
23. Central office administrators are responsive to the needs of the community. 2.739
21. Sensitivity to issues of racial and ethnic fairness is demonstrated by students, teachers, and administrators in our schools. 3.068
20. School personnel involve community services, such as mental health and law enforcement, to help meet student’s needs. 3.243
18. The community has a good understanding of the school’s programs and operations. 3.417
17. The community is actively involved in our school. 3.451
15. Our schools are preparing students to deal with issues and challenges they will face in the future. 3.492
14. I am satisfied by the way students are treated by building level administrators. 3.503
13. Our schools are doing a good job of helping students understand their moral and ethical responsibilities. 3.507
11. I am satisfied by the way students are treated by teachers. 3.560
10. The school’s programs assist students to understand and get along with people. 3.624
9. Our schools are doing an excellent job. 3.641
8. I am satisfied with our school corporation. 3.732
5. Citizens feel welcome in our schools. #9; 3.820
Jerry McKibben - Demographer
I met with Superintendent Yager, Jerry McKibben and others on Thursday night (09-07-2006). The reason for the meeting was to answer questions concerning the demographic studies done for 2002, 2004 and 2006. Upon review of the tables only, I found that the base number for years 2000 through 2003 differed in the 2204 and 2006 studies and these differed from the Indiana Department of Education.
As an engineer, I review numerous reports, studies, designs for accuracy and consistency. When I saw an “inconsistency” with no note on the 2006 study identifying there was a change, I wanted to know the reason for it. It would not be the first time a typographical error had occurred that wound up changing the outcome if it was actually used in a calculation/analysis.
Jerry McKibben is a graduate of Carroll High School, is friendly, comes across as genuinely interested in his subject material and very interested in explaining his methodology and rational behind his assumptions. We agree on many things for example;
- FWCS is losing students yearly
- Allen County is growing through people moving into it, not from birth rates. If people stopped moving in and moving out, Allen County would stop growing. I believe he stated the birth rate was 2.08, which is considered the magical number that results in zero population growth.
- EACS is not growing as fast as the County.
- This leaves SWAC and NWAC as the two remaining districts that basically get the growth for the county.
Jerry presented data showing the number of housing permits had risen for three years and then began to fall over the past two years and this year so far shows even fewer building permits. Though he did not present what I would call a full cycle (20 to 25 years) of housing permits he does use this to forecast enrollment.
His method breaks down population into its basic elements males, females, age, married status and more. Apparently Perry Township has data on this for a number of years. Using this information and the immigration (not foreigners – those who move into Perry) he forecasts how many births there will be over time to get enrollment numbers. Incorporating how many move out based on age and death of a spouse are also factors.
I do not find fault with his method and I understand it. However, I have in my years of experience found that when you get as detailed as this, that one can end up with the sum of the parts being greater than the whole or being less than the whole. For example one could say there would be 1,500 new people moving into Perry. By allocating these people to their respective categories, one must also subtract from the same identical categories all deaths, out migration, etc. otherwise you can get a compounding error. I am not insinuating or saying that Jerry’s program does this and I should have asked him if his program has a check to verify this is not happening.
My position is, when you look at it the level Jerry has, how accurate can you be with any one variable? In design we place tolerances on a bolt. We then have tolerances on a hole diameter in order to accept the largest diameter bolt. We then might have a position for the hole called out so that the two line up. We can get more complicated by having multiple parts combine. Each has to fit regardless if it at the minimum or maximum of its individual tolerance range. This stack of up tolerance is the same as stack up errors. As you get further from the source the compounding of all these small errors add up. Now the law of averages normally works in your favor where if your assumption was tiny bit high on one and a tiny bit low on another, they cancel each other out. This very well may be the case here.
I looked at the last 17 years worth of actual data and see a remarkable resilience within Perry to roll with the punches. We have experienced two recessions, two Gulf War Conflicts, 9/11, manufacturing jobs leaving, high interest rates and low interest rates and more. If anyone of these had any influence on the growth in Perry I would expect it to show itself in one or more years over the past 17. The only observable hic-cup I did observe was a trend in growth where growth grows for three years followed by slowing growth for three years and then repeats itself. These were very slight changes. Jerry suggested they were the state changing the age at which 5 year olds could start Kindergarten. Moving the date by one month would influence enrollment one time by 8% for that grade level. Over thirteen grades we would see less than a 0.75% change in growth. The state has apparently moved back and moved forward this date several times.
If this small change by the state can be seen mathematically, why then does not interest rates, wars, politics, recessions show up? If these are such big impacts, then they should be observable in the past 18 years. My view as I said before is Perry Township is very resilient.
With that said I think growth will be higher than Jerry's forecast, but not by much. Is the difference significant, NO? The forecast is much like a gas gage. Depending on if you driving highway miles or in the city, you tend to know where on the gage you need to fill up. It is a “heads-up” that you better start thinking about doing something. In the case of demographics, I would want something that can give about three to four years notice before the rubber hits the road so to speak. Jerry's forecast could very well be very accurate, only time will tell. I respect Jerry's occupation , forecast and the difficulty under which such calcuations are made.
Now comes the difficult part. To start my next section I would like to explain a few things about cash flow accounting and accrual accounting.
Cash flow accounting pays for all expenses as they come do. Nothing is set aside for future expenditures.
Accrual accounting takes into account that things wear out. If a new roof needs to be done every 20 years then an amount out of each year’s revenues is set aside so that in 20 years there are funds available to pay for the roof without cutting into other projects or floating a bond. The same goes for heating and AC, windows, paint and more. In many ways those items that are replaced on a daily basis (consumables) are built into the budget because their time frame is less than one year. But the larger expenses such as land, buildings, roofs, heating and AC, technology upgrades are not budgeted. The reason I am told is the State of Indiana does not allow school districts to set aside funds for future costs such as buildings or maintenance.
Is this a problem? The most notorious program in the United States that uses Cash flow accounting is Social Security. We all know it is facing huge unfunded liabilities. Just like this program, the NACS system faces an identical monster, on a smaller scale, but just as devastating in terms of percent increase in the tax rate.
When a school is built, a bond is generally floated to pay for it over some period of time 20 to 25 years. However before the bond is paid off, water heaters, roofs, windows, paint and heating units need to be replaced not once, but in some cases twice. If a school district does not accrual these items each year (set aside funds each year to pay for them later), then the school district is forced to float another bond. What happens is that those who are in the school district prior to the floating of the second bond do not pay for any of the maintenance costs associated with these items, but benefit from the prior investment. When a school system gets several schools, then you can get a compounding affect where after a period of time you are floating bonds equivalent to a new school.
In order to fund cash flow accounting, the tax rate will increase for several years after the enrollment has stopped growing and then levels off at a significantly higher rate than that with accrual accounting. With this type of accounting it becomes more difficult for the average person to distinguish the real cost of building a school from the cost of maintaining a school. Generally speaking maintenance costs are about 2% of the schools value yearly.
With this said, the renovation proposal for Carroll High School for $63.75 million is a bit misleading. Within this $63.75 million are budgetary amounts for technology improvements and a heating and AC improvements. These two items do not belong in the analysis for construction costs. Likewise they do not belong in the cost of a new high school either. By combining these costs, many people get the wrong impression of what is happening. Likewise when looking at increasing capacity at a school one must look at the replacement value of a school when it is converted to some other use. Point in case is the Freshmen Academy. Regardless of whether it was a good or bad decision, it has a cost impact. The direct result was that because it was converted from a middle school, the school district floated a bond to build a new 1,000 seat middle school.
What I propose is that all taxpayers in the state of Indiana write their individual legislators to allow our school districts to fund new construction by allowing building funds. Using accrual accounting our tax rates should not change and allow a higher level of funding long term using lower tax rates.
Table T-9 is the information you need
I received a copy of the June 2005 Feasibility study for NACS on September 7, 2006. I finally found some of the information I was looking for. The current square footage (sq-ft) for the Carroll and the Freshmen Academy as well as the proposed renovation can be found on page 35, Table T-9, Projected Data for Construction Costs.
Most of us have had to buy something at some time that we shopped around. It might have been digital cameras that have different options and different prices. It may have been a choice of five different homes with different locations, size and age again with different price tags. Both sides of the petition (yellow and blue) have been throwing out numbers, but where do these numbers come from? One side says it will cost $118 million for a new high school while another says it is more like $75 million. This Table T-9 is the key to this entire debate.
I looked at this table and first glance I saw a discontinuity so to speak. The report speaks about a building capacity, but then says a utilization rate of 85% is optimum. This means that if you build a school to hold 100 students, the most the school district wants to put in there is 85. 15 seats go on used. It was my understanding that an 85% utilization rate was used to determine the rate at which the revenue per student would fund this school. If utilization went to 80%, you would be negative cash flow based on design of 5% divided by 85% or 5.9%. On the other hand if you were at 90% utilization rate, you would be receiving 5.9% more funds than it took to fund the school.
Taking a look at Table T-9 clearly shows the current sq-ft per student for Carroll High School at 85% utilization to be 214 sq-ft per student. The Freshmen Academy at 85% utilization has 183 sq-ft per student. The goal was that any new school would have the same options as Carroll does now. Keep the schools equal. However, Table T-9 clearly identifies that the a proposed new High school with 1,425 students with 356,250 sq-ft would result at 85% utilization 294 sq-ft per student. This is 38% larger than Carroll’s standard. This also means that the cost to build this new high school is also 38% greater as well.
In addition, when I look at the renovated projection of Carroll the total capacity with the Freshmen Academy would be 3,100 but the total capacity of Carroll plus a New High School would be 3,125. Not much difference. However, in the optimum column of the Table T-9 in the row titled Renovate Current High School w/Freshmen Campus, I find they did not use an 85% utilization rate, but 81%. This increases the sq-ft per student for the renovated project, reducing the capacity from 1,445 to 1,381.
So what is the bottom line? When I look at apples to applies with the goal of having two high schools having the same total capacity of one renovated high school and also keeping the sq-ft per student the same, the cost of building a new high school is just under $70 million. The cost of renovation is $63.75 Million. Now what would you do? Would you pay $63.75 million for a 40-year-old school with a new addition or would you pay $70 million to get a brand new high school with very low maintenance costs for the first 20 years? In addition the cost savings for not bussing half the student further then needed reduces fuel costs, bus maintenance cost (fewer miles driven) as well as paying bus drives for fewer hours. In addition our children would see a drop in time on the bus.
But the analysis does not end here. We have a freshmen academy that was built to be a middle school and was up till a few years ago. It was decided to convert it to a Freshmen Academy and build new middle school. The problem is we did not need a new middle school. Between Maple Creek and Carroll Middle School there was excess capacity well into the future. This required a new bond be issued that we as taxpayers are paying on. This bond increased our taxes we pay. The value of this school with land is most likely around $20 to $24 Million. On top of this the utilization rate of both middle schools have dropped considerably adding to increased cost per student to pay for empty seats.
If we were able to use the Freshmen Academy as a school in the future, we would save $20 million by not having to build a new one. We either add this to the renovation total cost or subtract it from the new school cost.
Then there is the assumption of $275 per sq-ft. The Indiana Department of Education states building costs are about $150 per sq-ft. The renovation cost is $161 per sq-ft. Renovation normally cost at a minimum 30% more than new construction because you have to tear down, cart away material and work in cramped areas taking more time. Yet Table T-9 uses the $275 per sq-ft cost for a new high school and $161 per sq-ft for the renovation.
What happens if we use the $161 sq-ft for a new high school? The cost drops to just under $39million. Does this include land? If not add in another $9 million to cover parking, land, utilities and you are still under $50 million.
Staffing cost increase
Custodial services are estimated by NACS to be $4 per square feet (page 43 of study). This means Carroll’s and the Freshmen Academy currently cost $1.672 million to clean. If we build a new high school (using the current 214 sq-ft per student) and use the Freshmen Academy for something else, the cost of Carroll and the $2.199 million. The cost of custodial after renovation is estimated at $2.474 million per year. A new school in the long term saves $275,000 per year after schools reach capacity. Now under both options custodial staff can be kept lower until classrooms become occupied due to enrollment. Table T-10 identifies an increase of $1,123,388 in staffing costs to open a new school. This $1.123 million is based on the assumption enrollment is 1,425. However, based on the standard utilization rate of 85%, enrollment would only be 1,126 at the new school and Carroll would have 1,445
Appendix A-3 identifies the staffing cost for a new school. They principal makes $105,000. If renovation goes through, will the current principal still make just $105,000 after nearly doubling the workload? What about guidance counselors, generally speaking they are based on enrollment. Between Carroll and the Freshman Academy there are currently 6 guidance counselors. Clearly 2 of these would be moved to the new school requiring just 2 new staff at most. There are currently 20 aides who would move in the same proportion to students they now cover. The same goes for the special education. Based on current staff being moved in t same proportion of students, the net increase in staff is actually limited. There are eight teachers’ positions where duplications are not available. Some have few numbers of students. This might lend itself to them teaching at both schools. No new custodial or food service personnel are needed since we are serving the same enrollment size. Enrollment determines square footage and square footage determines cost.
In summary the maximum staffing increase to open two schools is under $700,000. If you take into account less sq-ft than the renovation option and its custodial savings of $275,000, the net increase drops below $500,000. Bussing savings will reduce cost even more.
Based on this study done by the NACS board, I find that we need to hold off on doing anything until the right numbers are presented.
I will be changing some of my previous posts
I met with the Superindendent, Demographer and others last night for nearly three hours. The demographer Jerry McKibben is a very personable individual. He came across as hones, very open and excited to be talking about what he does for a living. He explained his methodolgy and why the enrollment values in three seprated locations for specified past years were different.
Though I personally would have placed a note on the individual pages containing the tables noting the differences, this does not mean that it is wrong to do so. I have not had a chance to look at the hard copy results, but I was told it explains why they are different.
I also was provided many answers to questions. Due to timing, I have not had an opportunity to correct and add to some of my previous posts. I intend to do so in the near future.
Information in previous posts concerning NACS and the remonstrative will be up dated. I believe it will take me a day to reconcile and present my analysis. Thank you for your patience.
Who knows what if anything?
I went to the meeting at Convenient United Methodist Church to listen to information on renovation Vs a new high school. I did this because those supporting the renovation would be there and I truly wanted data so that I could truly understand the situation. I assumed they would be putting fourth information in support of renovation. However, what I heard in the short time there was more fuzzy feally good words, but nothing quantified.
The NACS school board states they have done studies on a new high school saying the cost would be $118 million. They did a cost impact as well on staffing two high schools versus one renovated school and it was determined that it would cost $2.9 million more per year to staff two high schools.
The demographic study done in 2004 showed that renovation might be exceeded in 2016 and then later in the July 2006 study showed the high school enrollment had dropped.
My expertise is analyzing data. I do not need nor want emotional, fuzzy, unsubstantiated numbers, but the assumptions and analysis. You would think that would be fairly easy to come by. Tonight I asked the principal of Carroll how many unique classes were offered by Carroll and how many teachers there were. She could not tell me. I am not sure about you, but I would certainly expect the principal of any school be able to identify the number of teachers reporting to them. I would also expect them to know precisely how many different courses the school offered.
The entire reason why there is a remonstrative is that a large group of people will not accept numbers on face value, but need to read and understand how these numbers were arrived at. It does not mean the numbers are wrong. However, because there have been so many conflicting numbers bantered about, which ones if any are correct.
Credibility can be lost very easily when simple out right errors of discrepancies are found. Because of the lack of data and information the school board has lost credibility in my eyes. We may not need a new high school, but what I do know is we do not need to renovate now. We have several years. We should take one year to look at the data and discuss all options.
I would rather error on the side of waiting another year then spending $63.75 million only to find that with a little more time other options might prove cheaper and better.
NACS Demographic Studies
McKibben has done several demographic studies that are available on the net. After looking at several, they had similar if not identical an initial statement on page 2. I was sent the table of three different studies. The titles are:
- Northwest Allen County Schools: Enrollment Projection January 2002
- Northwest Allen County Schools January 2004
- Northwest Allen County Schools: Enrolment Projections July 2006
“
By demographic convention, a distinction is made between a projection and a forecast; a projection extrapolates the past (and present) into the future with little or no attempt to take into account any factors that may impact this extrapolation (e.g., changes in fertility rates or migration patterns); a forecast results when a projection is modified by judgment to take into account such factors and changes.
The results of this study are to be used as a planning tool, therefore, the ultimate goal is not merely to project the past into the future, but to assess what the likely future may be. Not all of the historical trends have been extended throughout the study period without modification. Forecaster’s judgment has been used to modify some of the demographic trends to more accurately take into account likely changes. Therefore, strictly speaking, this study is a forecast, not a projection; but the two terms will be used interchangeably throughout the report.
When calculating population projections of any type, and particularly for “small” populations such as a school district or its attendance areas, reasonable assumptions must be made as to what the future will bring. The demographic history of the school district in relation to the social and economic history of the area is the starting point and basis of most of these assumptions. The unique nature of each district's demographic composition and rate of change over time must be accounted for and assumed to be factors throughout the life of the projection series. Furthermore, no two populations, particularly at the school district and attendance area level, have exactly the same characteristics.” [1]
The NACS sent just the table and nothing else. From the title on studies for 2002 and 2006, these were projections and McKibben’s written definition of a projection, I assume his studies did not take into account any factors that may impact this extrapolation (e.g., changes in fertility rates or migration patterns). This is contrary to what the superintendent stated at the 10/28 meeting as well as the August 23 meeting.
If this is truly a projection extrapolating the past (and present) into the future, then anyone should be able to do this. Applying the 1989 through 2005 actual enrollment numbers I calculated a nearly perfect correlation of 0.9995. The formula is not linear, but exponential.
The table below lists the actual enrollment reported by NACS to the Indiana Department of Education. I used data from 1989 through 2002 to determine my projection. I assume McKibben's January 2002 study used the same data. Enrollment data for 2006-07 school year is a school count as of August 29, 2006.
Year actual Larsen/accuracy McKibben/accuracy [2]1989 2,715 2,660 2.1% 2,761 1.7%1990 2,818 2,789 1.0% 2,840 0.8%1991 2,856 2,926 -2.4% 2,890 1.2%1992 3,061 3,068 -0.2% 3,050 -0.4%1993 3,208 3,218 -0.3% 3,217 0.3%1994 3,333 3,375 -1.2% 3,159 -5.2%1995 3,476 3,539 -1.8% 3,478 0.1%1996 3,759 3,712 1.3% 3,517 -6.4%1997 3,921 3,893 0.7% 3,912 -0.2%1998 4,121 4,083 0.9% 4,161 1.0%1999 4,296 4,282 0.3% 4,314 0.4%2000 4,474 4,491 -0.4% 4,485 0.2%2001 4,712 4,710 0.0% 4,795 1.8%2002 4,961 4,939 0.4% 4,973 0.2%2003 5,236 5,180 1.1% 5,145 -1.7%2004 5,519 5,433 1.6% 5,271 -4.5%2005 5,780 5,698 1.4% 5,364 -7.2%2006 6,086 5,976 1.8% 5,418 -11.0%Clearly the 2002
[1] McKibben West Noble Demography Report 2006, page 2
[2] the pdf file was of poor quality. Trying to distinguish between 3, 5, 6, 8 and 9's were difficult. K-5, 6-8 adn 9-12 totals were inputted and totaled and compared to the total on McKibben's projection. There were differences and are due to poor legibility of all values.